<<Previous | ToC
| Next >>
When your program is broken, when it doesn't do what you thought you told it to do, we say "It has a bug." The term "bug" came out of the earliest computers, which used mechanical relays to do their logic. One day they were getting wrong answers and the technicians finally isolated the problem to a moth that was trapped between the contacts of one of the relays, preventing it from completing the circuit. Now everything is software, so instead of technicians making circuit measurements with a volt meter, we have a software program whose job it is to show what is happening inside your program, and it is called a "Debugger" because its purpose is to help you find (so you can remove) the bugs in your program. The debugger does not find anything, you do that. The debugger merely shows you in a graphical way what you told the computer to do, so it's easier for you to see how that is different from what you wanted to tell it to do. Only you know what you wanted; the computer only knows what you actually told it, and it does exactly what you told it to do.
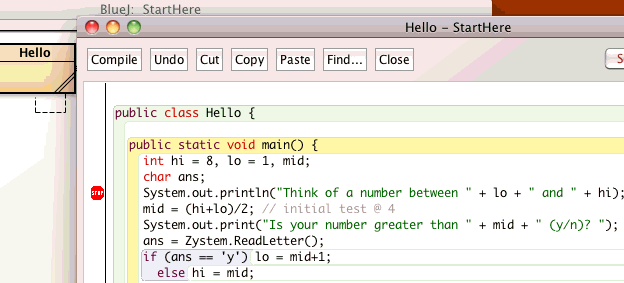
On the left margin of the program code window (after you compile it) is a narrow white strip that if you click in it, BlueJ adds a little stop sign at or near where you clicked, like this:

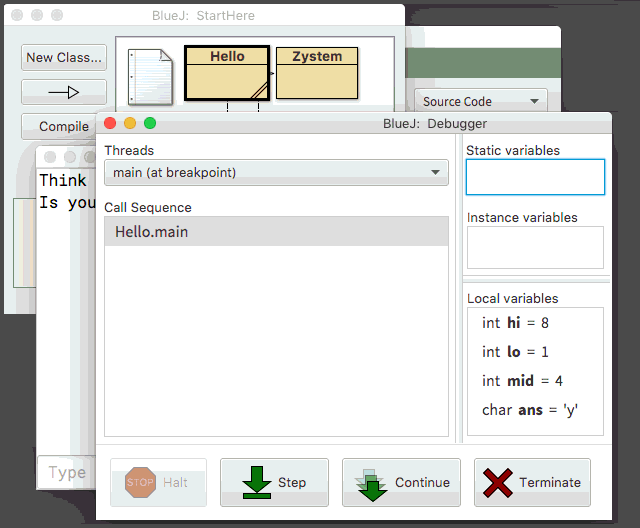
This is called a breakpoint, because when you run the program and it gets here, it will pause and open a Debugger window that looks something like this:
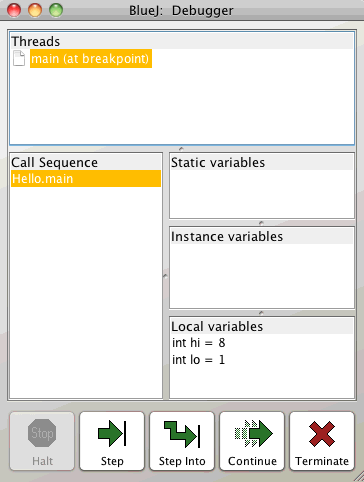
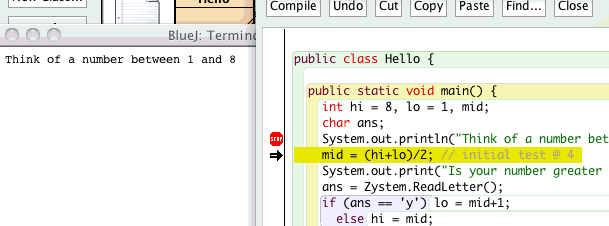
For now we are interested only in the "Local variables" panel, which we can enlarge by dragging the dividing lines between the other panels away (up or to the left). When you click on the "Step" button, the program does one statement, which in this case prints one line to the console window, and moves the little arrow in that margin panel to the next statement line, thus:
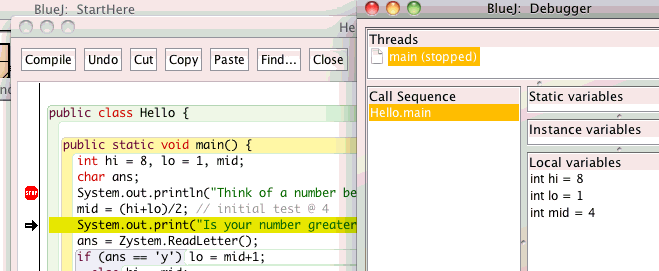
Step again and the program assigns the value 4 to variable mid, which now also shows up in the "Local variables" panel:
Step a couple more times and the Debugger window goes gray, because the program is not paused at a statement, it's waiting for you to type something into the console window.
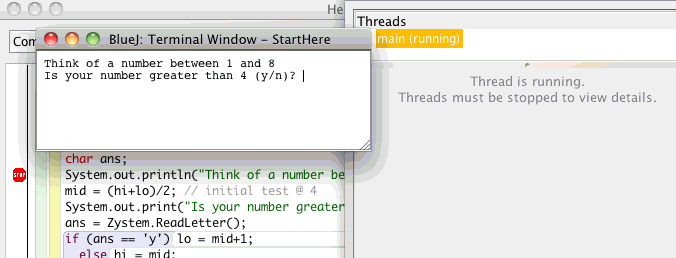
Type "y" and Enter in the console window and the program advances to the next statement line, with the newly defined value in variable ans. At least that's the way it's supposed to work, and it worked that way when I first wrote this page four years ago, but programmers are an anarchic lot -- not you, I hope -- and they are constantly "improving" things, "fixing" things that are not broken, with the result that stuff that used to work breaks. Today, the program didn't stop at the next line. We call a mistake like this a "bug" but it's their bug, not yours. By the time you do this, maybe they will have fixed the bug and it will work correctly again. Or not. If it doesn't stop at the next line, click the red "X Terminate" button and put another breakpoint on each line after a "Zystem.ReadLetter()" then start over. You might want to clear the Terminal Window (from the menu) before you restart. When you get to each "Zystem.ReadLetter()" line, click the "Continue" button instead of "Step" and your program will run at full speed until it gets to the next breakpoint. A lot of debuggers have this particular problem at one time or another, so I do this a lot. You will get used to it.
 If
you have a small screen like the laptop I'm testing this on today, you
have four windows each filling more than their share of the screen. I try
to arrange the windows (slide them around) so that a piece of each window
is showing off in one corner or another, so that no matter which window
is in front, some corner of every window is still visible, and I can click
on the visible corner of any other window and bring it to the front when
I need to look at it. Many programs have a "Windows" menu, and you can
choose the window you want from the menu. The version of BlueJ I'm using
today has such a menu, but they didn't do it correctly, it's only visible
when you bring the console window to the front (which if it's buried is
not much help).
Here, for example, I placed the debugger window in the lower right corner, the source code window in the upper right corner, the terminal (input & output) window in the lower left corner, and the BlueJ "StartHere" console window in the upper left. Some of the corners are offset slightly to make it easier to see which windows go with which corners. Once you like where the windows are, if you don't keep moving them around they will stay there, even after you quit and resume the next day.
The next time you click on Step, the arrow jumps over the "else" line and goes directly to the next evaluation of mid. Do you understand what happened? The condition "(ans == 'y')" evaluated to true, so the statement attached to that test was processed, and not the else-part. Step on down to the next input, but type in "n". See, the condition is false this time, so it updates variable hi and not lo. Each time the program comes to an if/else combination, part of your code gets skipped over. If you draw a single line snaking through all the statements that execute -- that is, the computer does what they say to do -- and omit or bypass the statements that are skipped because the condition went the other way, it is called the execution path. It is useful to think about the execution path because it will help you to understand why a variable was or was not set (and other things too, as we will see later).
An important part of computer programming is being able to think like a computer, and watching the debugger step through and do its thing is a good way to learn that. Eventually you should be able to think through the steps without watching them most of the time. All of us need to look occasionally, because we make mistakes, and it's sometimes hard to see through what we are thinking (when it is wrong) to what the computer is actually doing.
Next: Iteration
<<Previous | ToC | Next >>
Revised: 2021 July 23